


 MENU
MENUProblem:
How do I create iso-surfaces, exclusive to each zone, for the same iso-surface variable?
As seen in Figure 1, Tecplot 360 will create iso-surfaces in both volume zones for the Mach variable because both zones contain this variable. What can be done if one iso-surface is to be seen in one zone, but not the other zone?
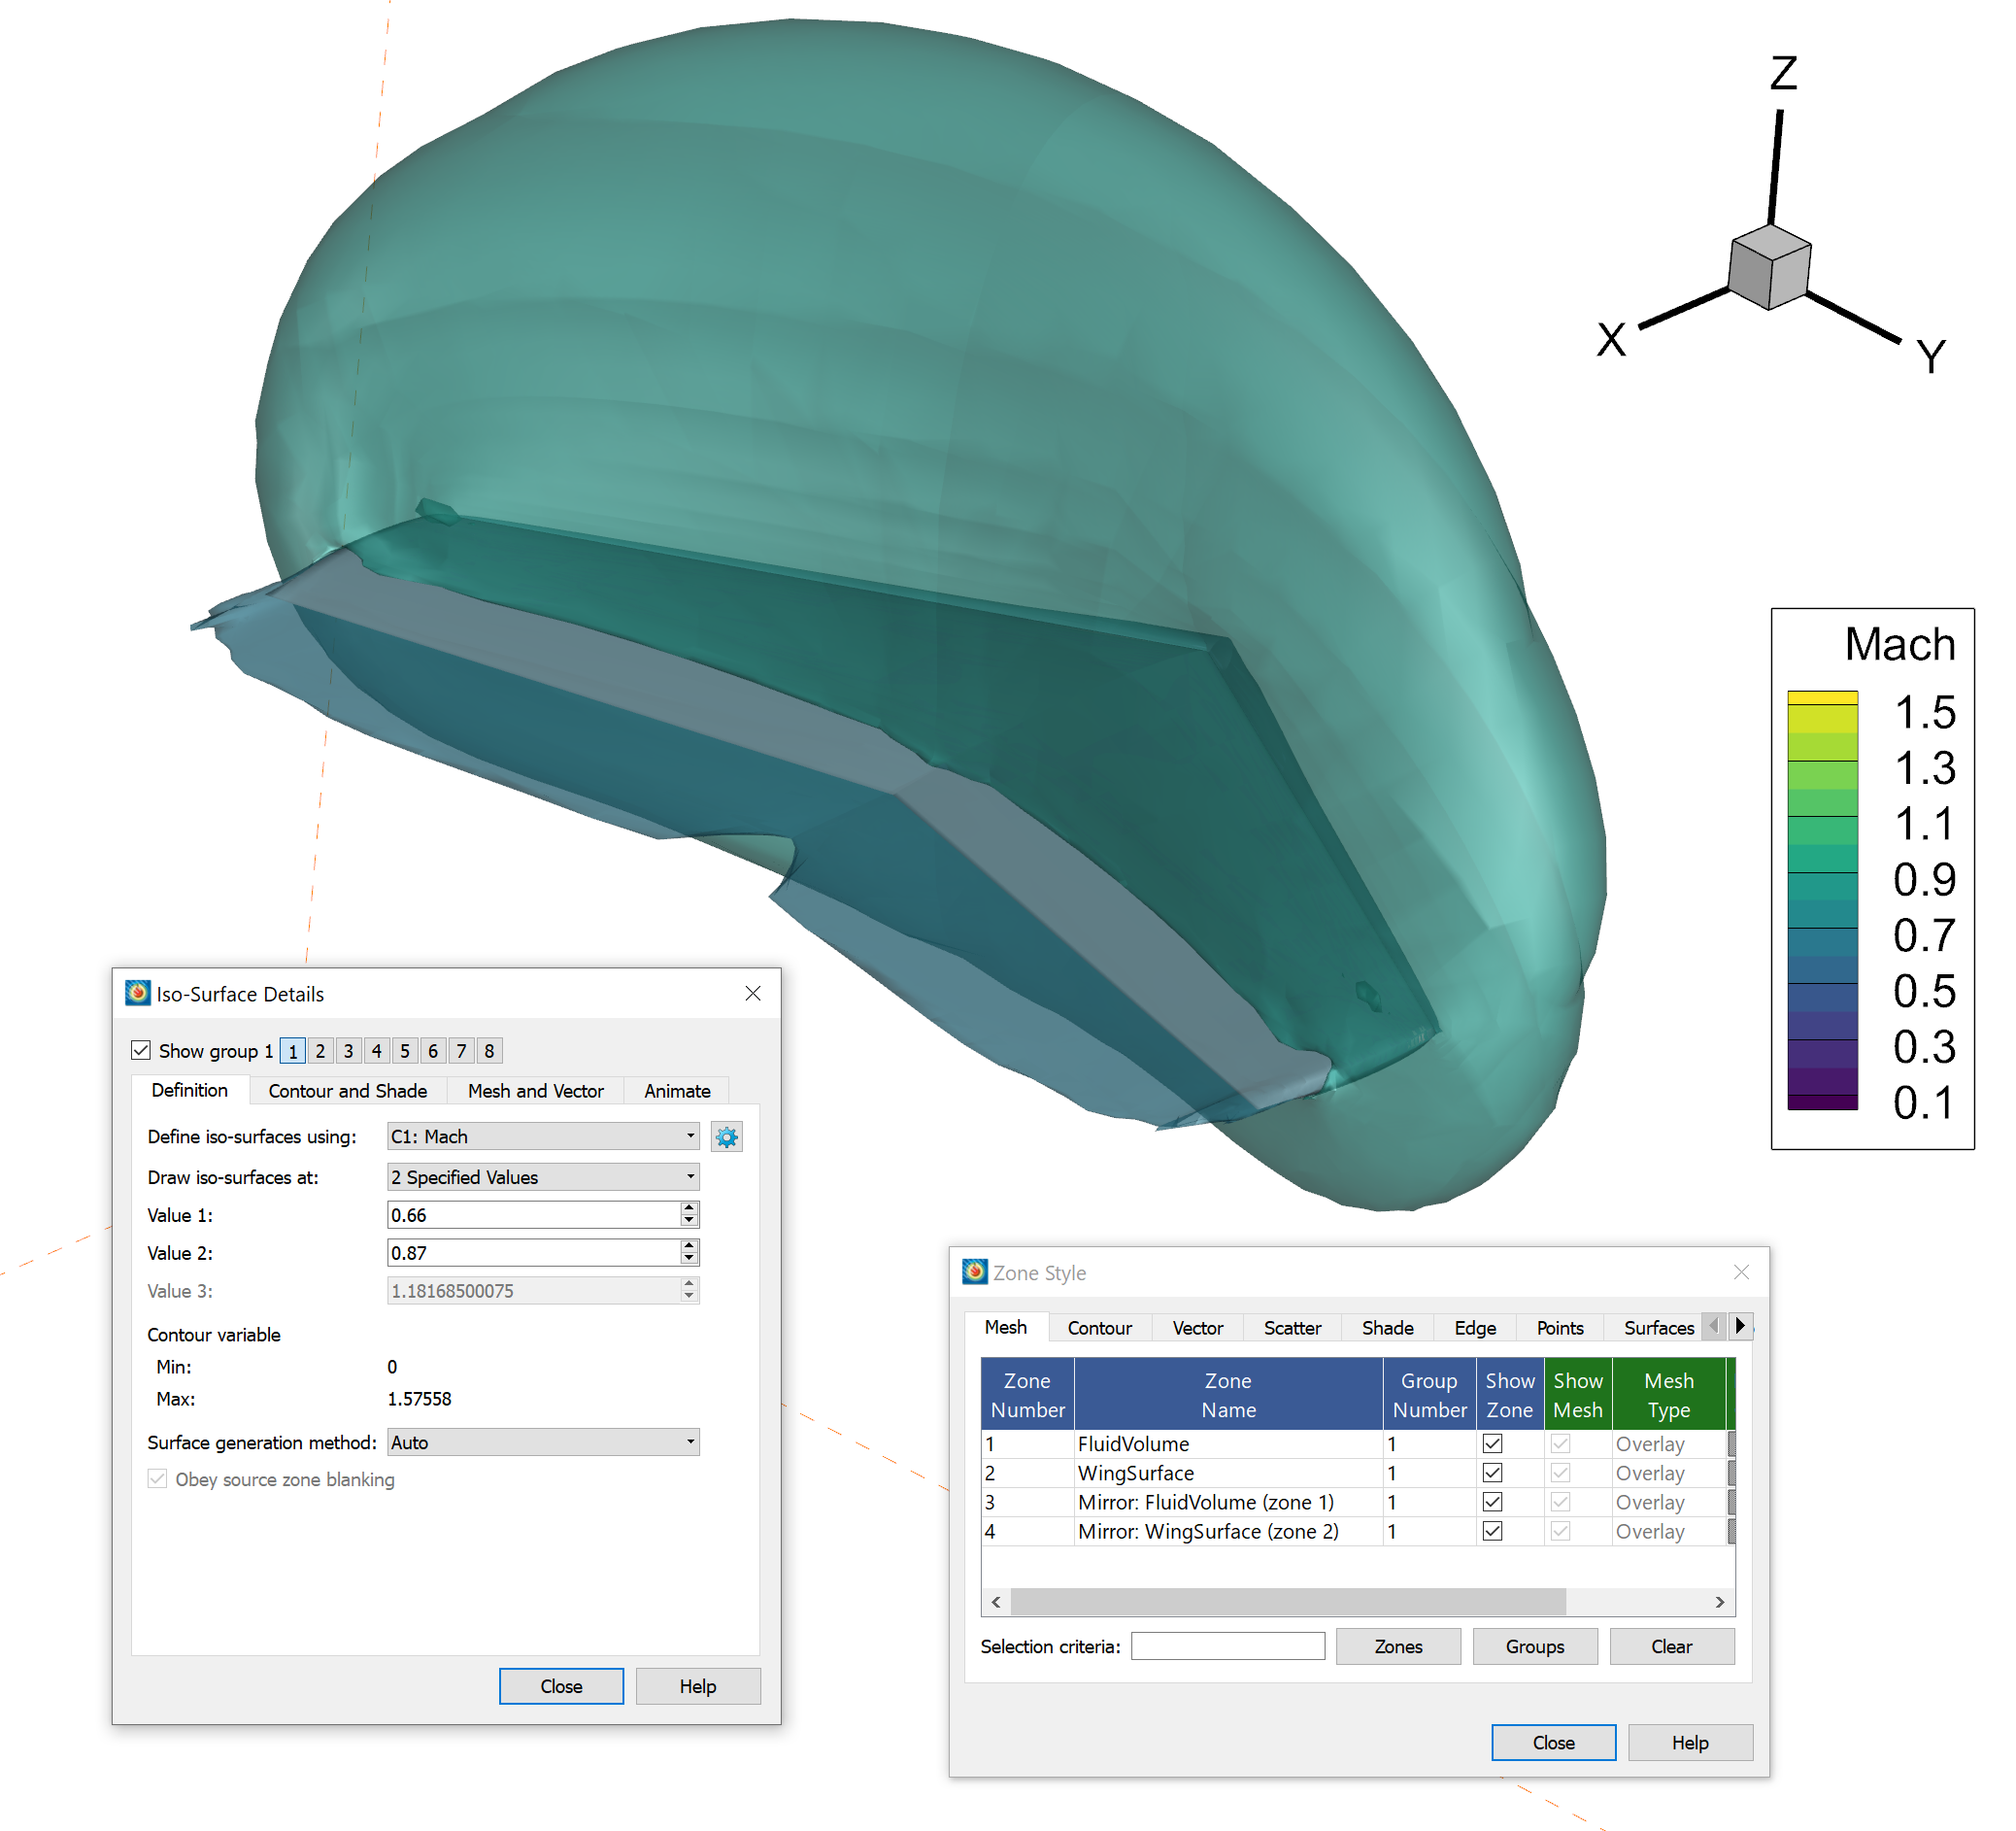
Figure 1: Problem – The iso-surfaces for the Mach variable from zone 1 to zone 3 are not unique
Solution:
Essentially, this procedure duplicates and renames a variable to each zone in which you want unique iso-surfaces. Then, the data values for this new variable are removed from the parent zone so that they exist only in the desired zone. Finally, iso-surfaces are created using the new variables (see Fig. 4).
The following procedure utilizes the Onera M6 Wing data file found in the Tecplot 360 installation directory examples folder, OneraM6_SU2_RANS.plt:
1) Go to Data>Create Zone>Mirror… and mirror both zones along the XZ plane.
2) In Data>Data Set Info…, double click the Mach variable in zone 1 and rename it to Mach_Zone1.
3) In Data>Alter>Specify Equation… create a variable called mach_Zone3 using the equation in Figure 2. Make sure to only create mach_Zone3 in zone 3 by selecting zone 3 in Zones to Alter, see Figure 2.
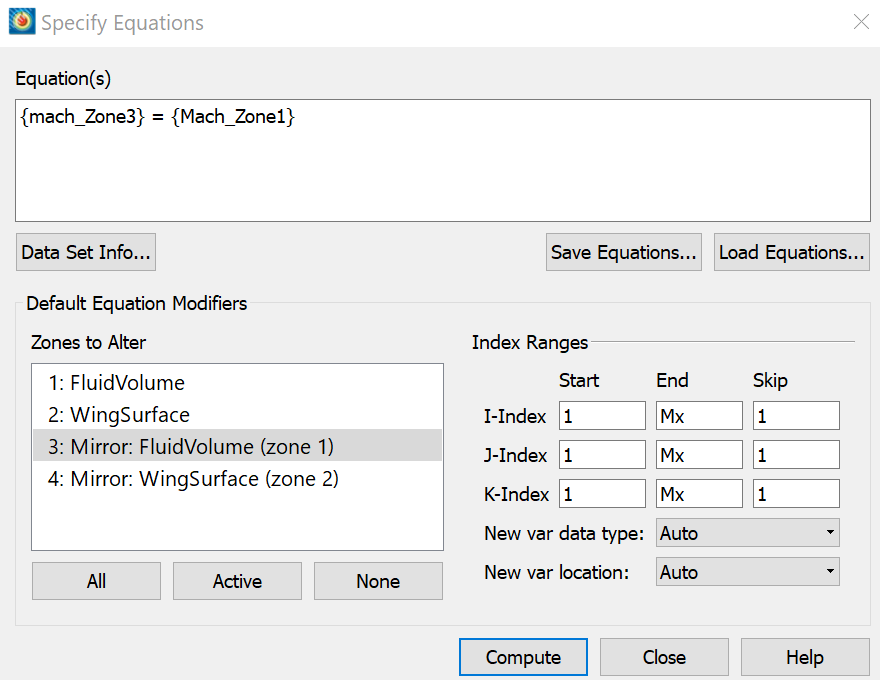
Figure 2: Step 2 – Creating a duplicate Mach variable, mach_Zone3
4) Also in the Specify Equation Dialog, set Mach_Zone1 = 0 in Zone 3.
5) Select the Contour Details… button on the side panel, set the contour group 1 (C1) variable to Mach_Zone1 and group 2 (C2) to mach_Zone3 so they are available for the iso-surface settings.
6) Adjust the Iso-surface details dialog by clicking Iso-surface Details… on the side panel and going to the Definition tab. In this example, see Figure 3, I defined iso-surface group 1 using the Mach_Zone1 variable. Similarly, in Figure 4, I clicked iso-surface group 2 and defined the iso-surface using mach_Zone3. You should now see iso-surfaces unique to each zone for the Mach data. See Figure 4 below:
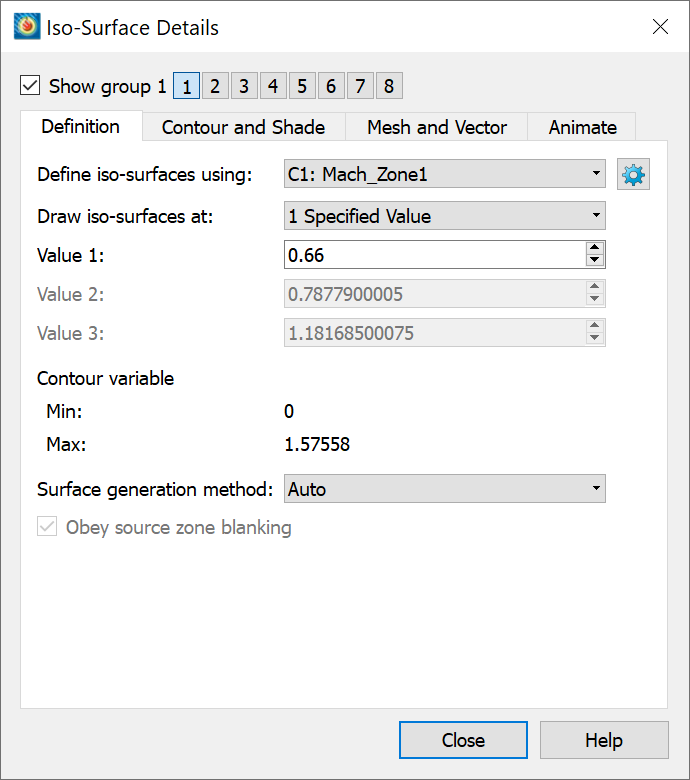
Figure 3: Iso-surface group 1
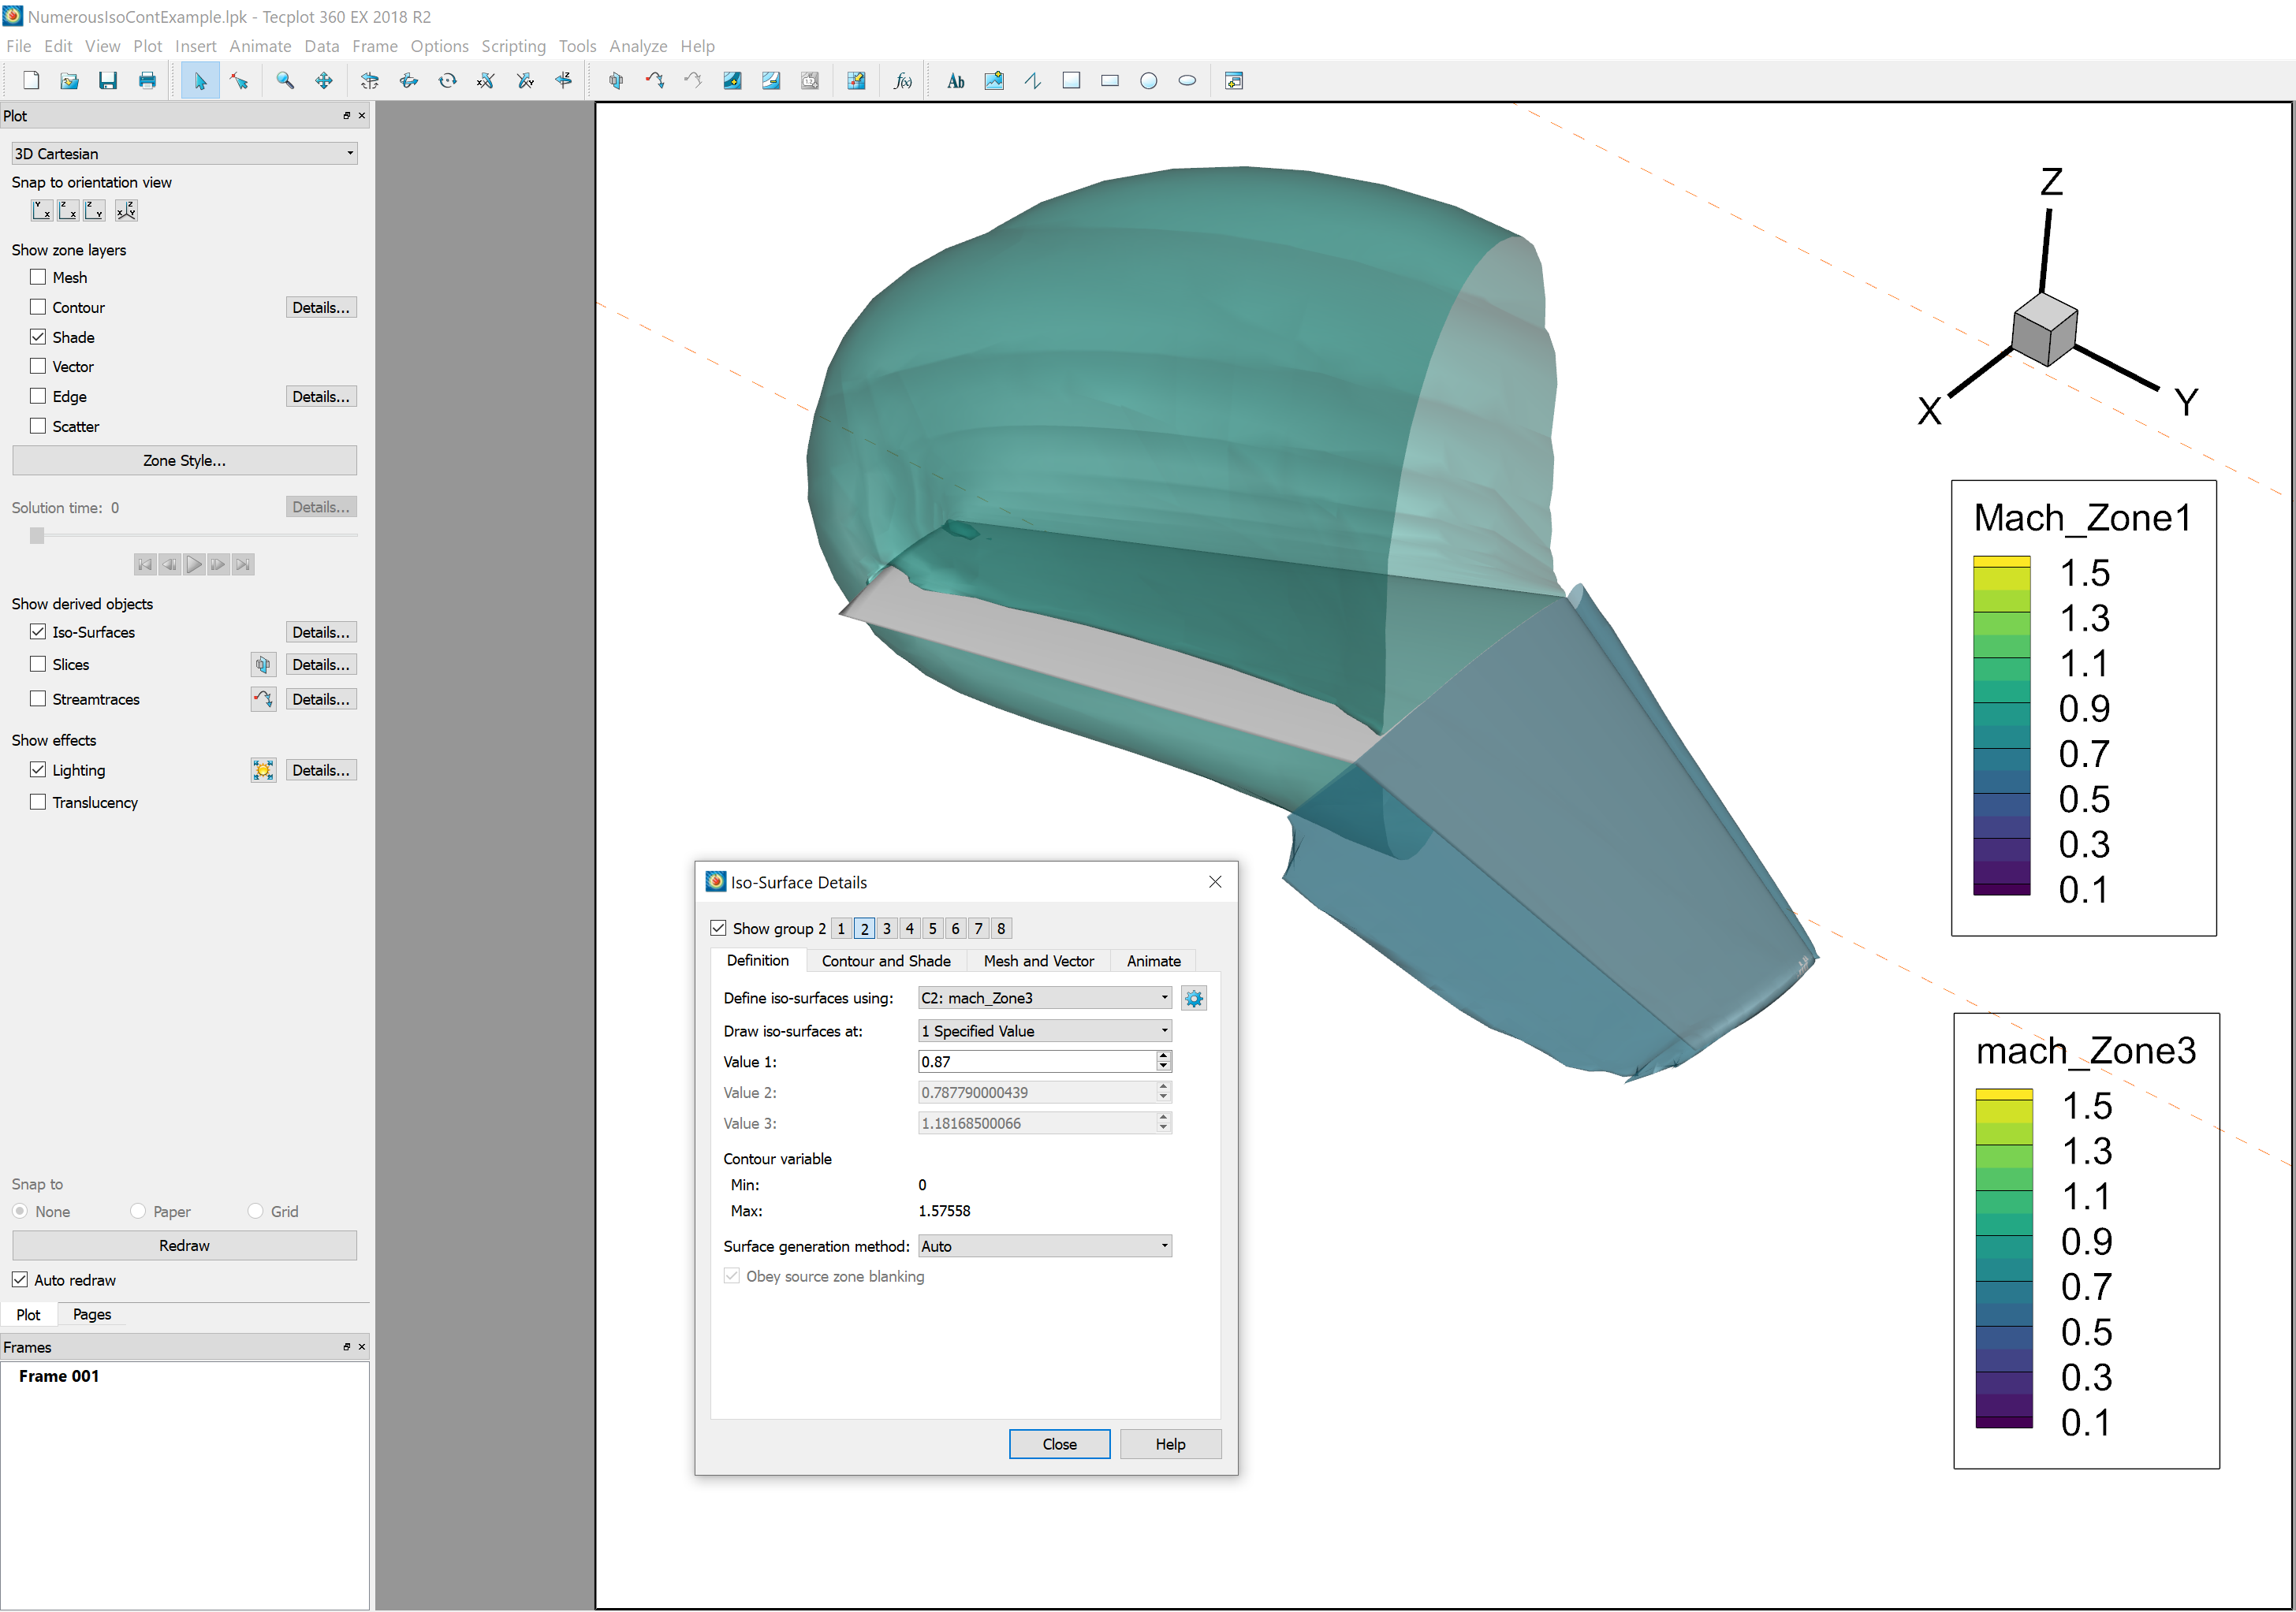
Figure 4: Completed plot with unique iso-surfaces in each zone for the Mach values