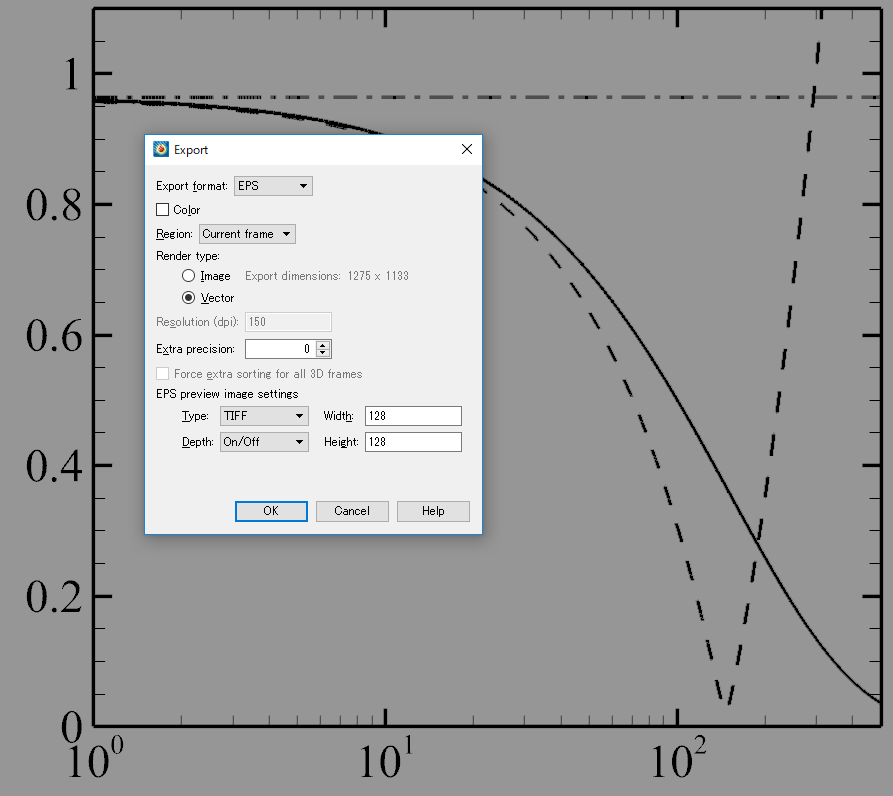
Problem: When I export an image of my dashed XY plot as a .EPS file, the dash spacing is altered and irregular.
Detailed Example Case: When I export the plot to eps file and open it, the patterns of the dashed and dash-dotted lines are inaccurate. The pattern interval is not uniform and sometimes the dot in the dash-dotted line vanishes. These are highlighted in red:
Plot before exporting (correct dashed lines):

EPS format after export (incorrect dashed lines):

Solution:

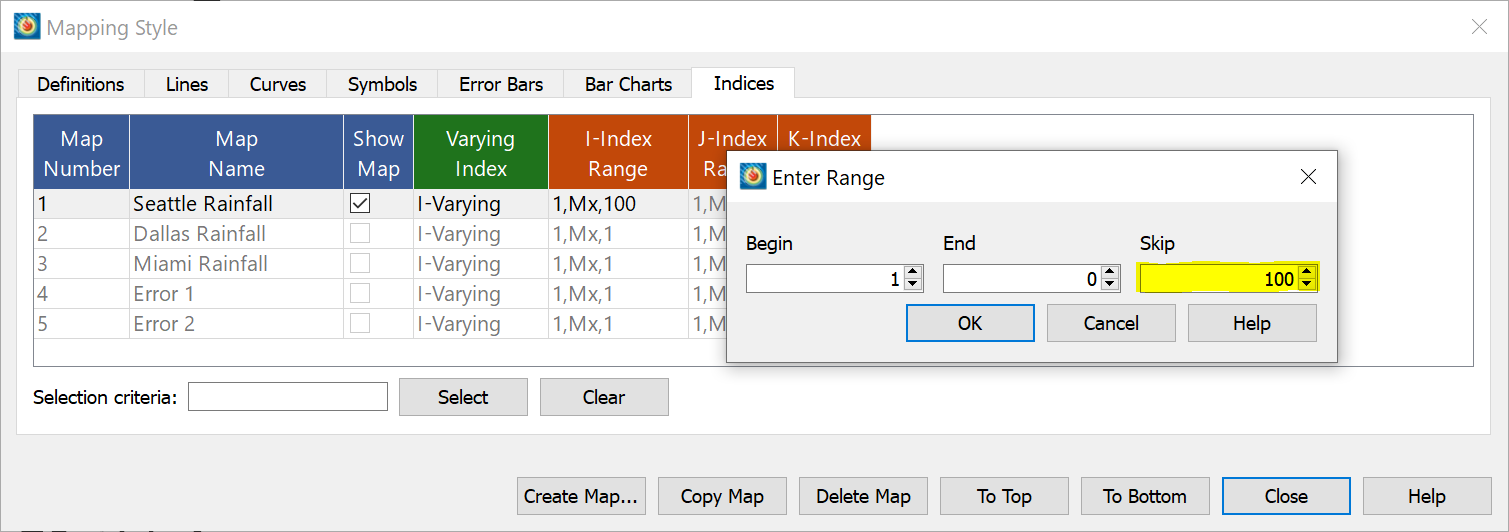
- Click on the Mapping Style Dialog.
- Select the Indices tab.
- Right click on the I-Index Range.
- Set to something like 1, Mx, 100 and see what happens. If that works keep changing the skip value down to the smallest value that still allows line patterns to work.
EPS files with line pattern plots can break down if the number of data points becomes too dense.
In this example, the user had x values spaced at an interval of 0.04 units. Changing the I-index Range from “1, Mx, 1” to “1, Mx, 10” gave an output that matched the original plot.
More information about exporting Encapsulated PostScript files can be found in the User’s Manual in the section about EPS Export.


