MENU
MENUProblem:
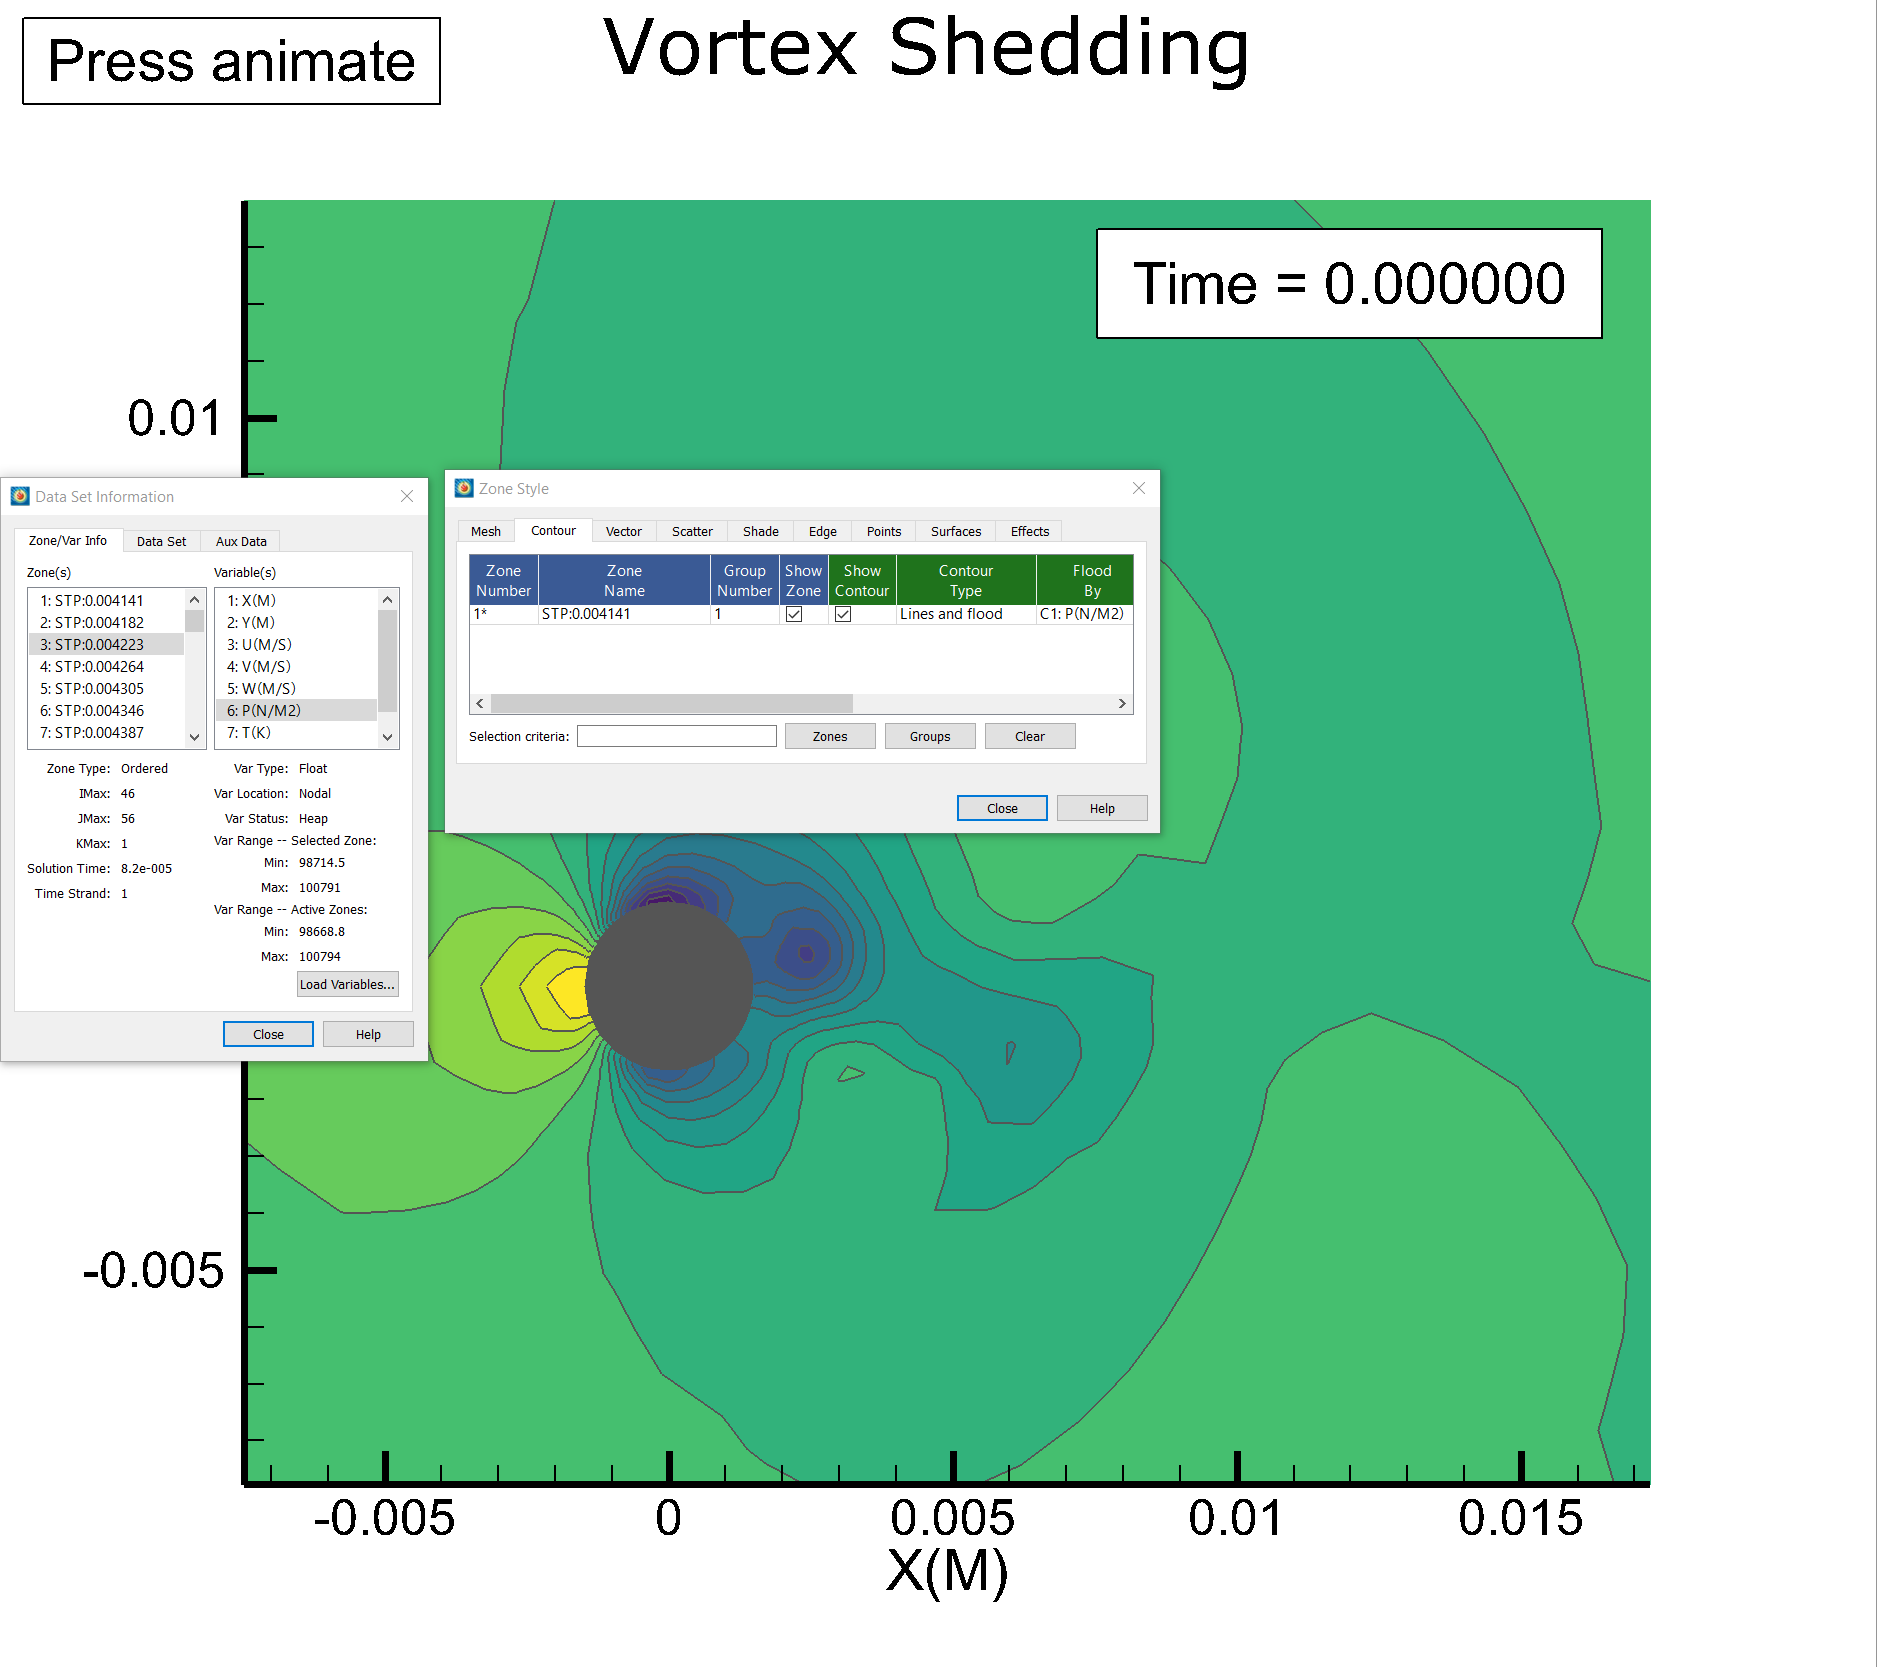
The min-max values shown in the Data Set Information dialog do not show values across all time.
Solution:
If you have transient data, the min-max for a variable is only for the “active zones” which unfortunately means only the current time step because the other time steps are not currently active.
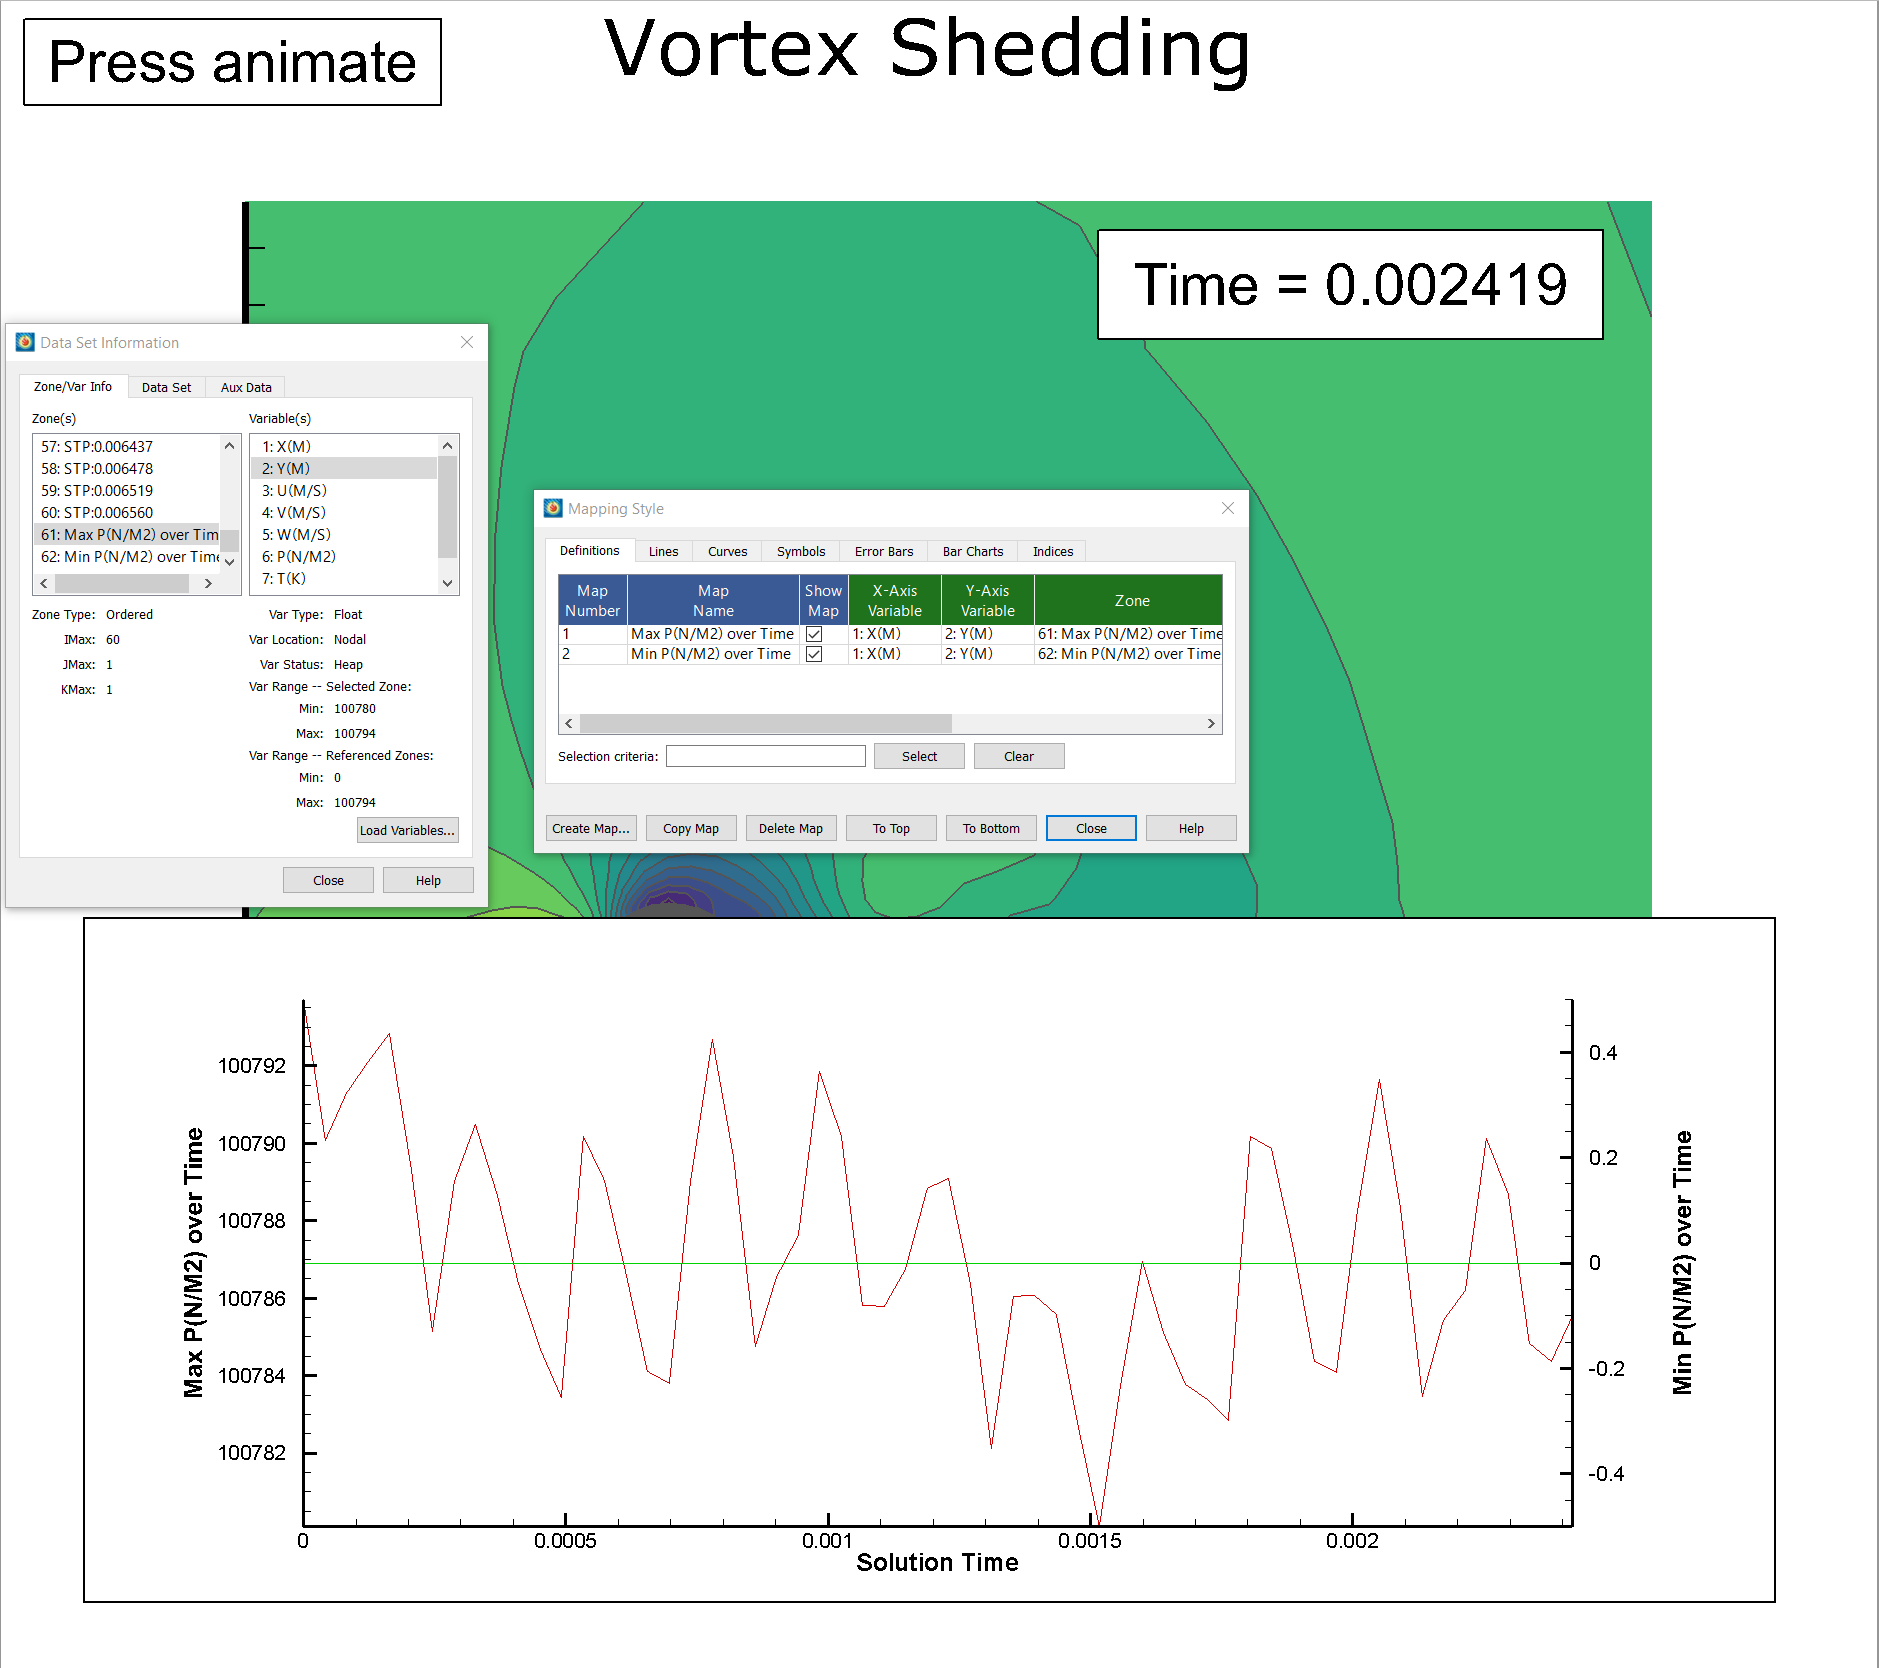
To see the min-max for the entire data set, run the PlotMinMaxContourOverTime.mcr macro from the Tecplot handyscripts GitHub page. The macro plots the min-max for contour variable of contour group one over time.
This allows a quick view of the minimum and maximum values of the contouring variable for each time step.
Note that this macro only works for transient solutions beginning at solution time = 0.0. Otherwise, the macro will introduce errors in the process.