


 MENU
MENUQuestion:
Why is there a difference in Tecplot’s integration average results and the average, or mean, I am calculating over all the data values?
Example: I have nodal data and I want to calculate average U velocity on the following domain (see Figure 1). When I use the integration average feature (Analyze>Perform Integration…>Average>U), I calculate 38.90 m/s. But when I calculate the average over all the nodal U values in Excel, I calculated 38.34 m/s. Which average is correct? Why are these results different?
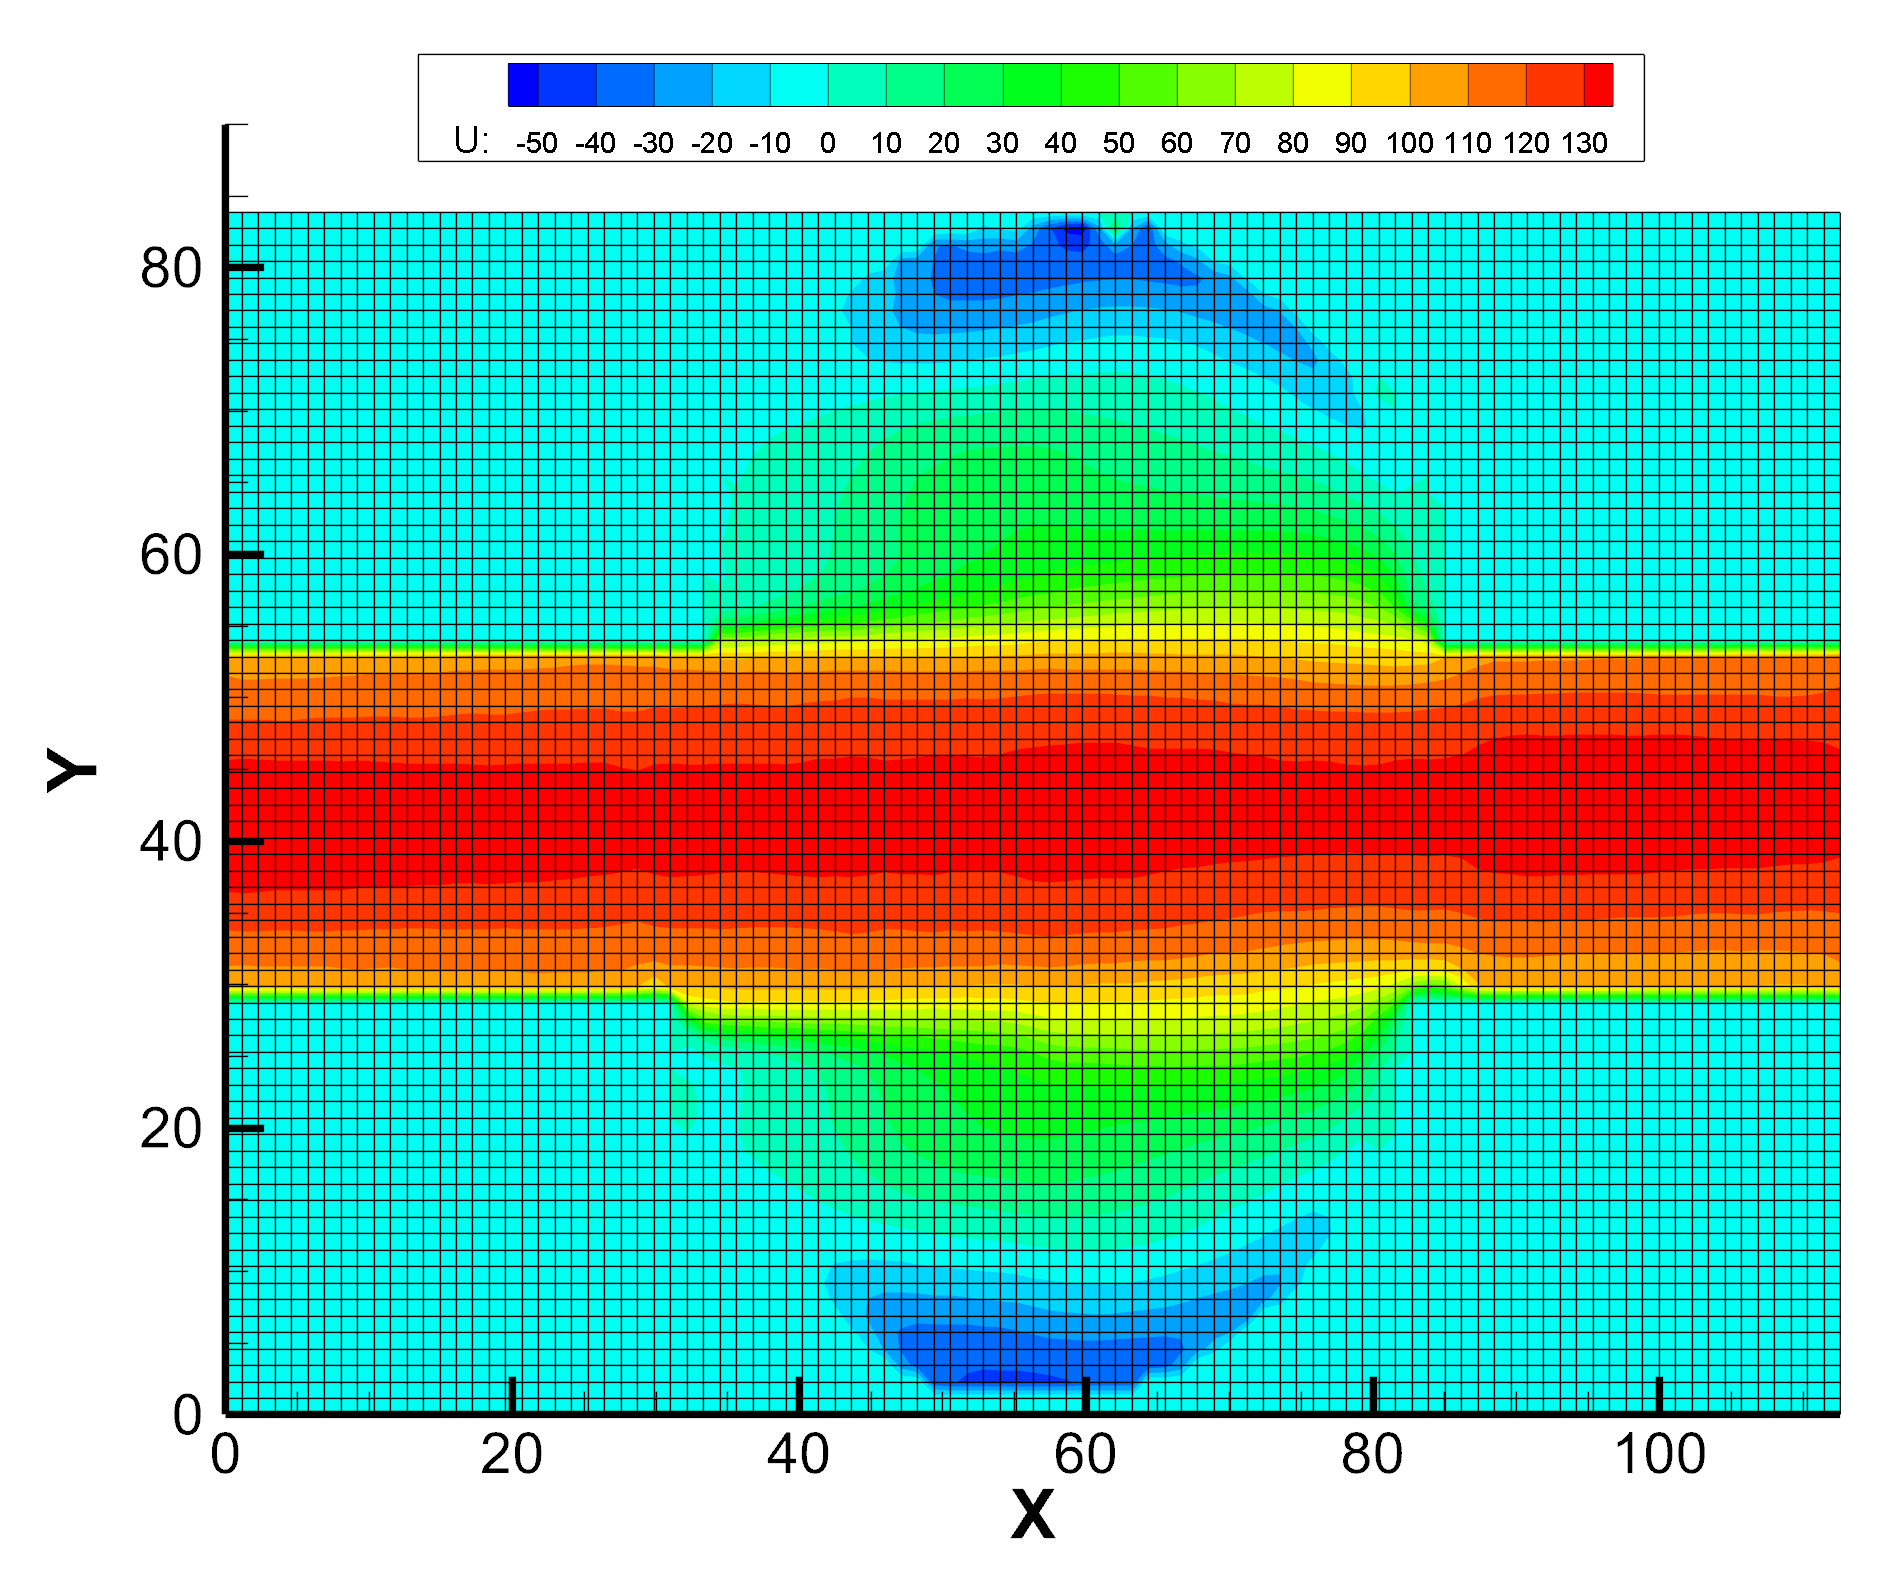
Figure 1: Plot with mesh and contoured by the U variable. Example data and image used with permission.¹
Answer:
The essential difference is that the Average Integration feature gives “…the area or volume-weighted average of a single variable over the domain” (see the Performing Integrations section of the User’s Manual) while the mean is not a weighted average. See below for an explanation of Tecplot’s weighted average and the arithmetic average.
Density may be the best example for understanding the contrast between arithmetic and weighted average. Consider Figure 2, a 2-cell plot with the cell-centered values of density labeled, and the plot titled with Tecplot’s calculated integration average:
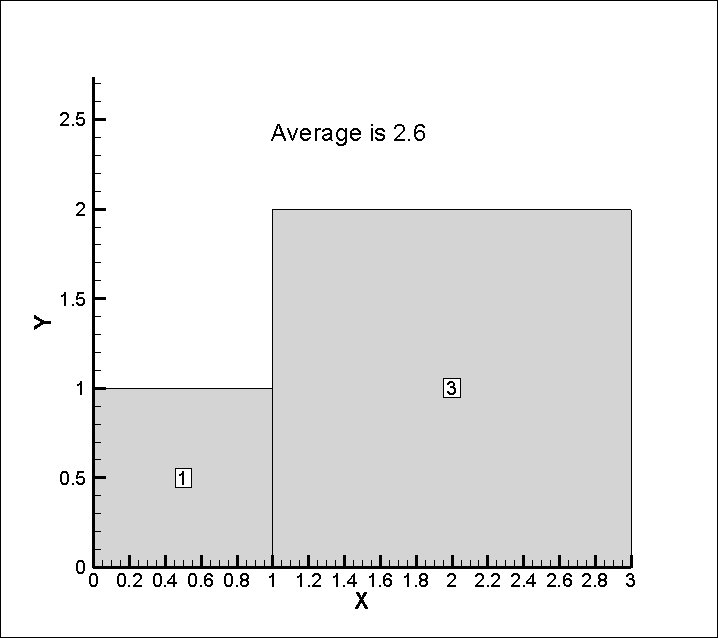
Figure 2: A 2-cell plot with the cell-centered values of density labeled. It is titled with Tecplot’s calculated integration average.
The average density that makes sense is not 2.0 (arithmetic mean/average) but 2.6 (weighted average). Consider what would happen if you sub-divided the smaller cell into 9, each with a density of 1. An arithmetic average would certainly change, but Tecplot’s integral average would not.
Further more, if I have nodal data, how are cell values calculated and used in integration averages?
See the section of the User’s Manual on Performing Integrations:
“Integrations of a variable or variable function use the trapezoidal method, and are second-order accurate.
For each segment, face, or volume cell, the appropriate nodal or cell-centered values are averaged and
multiplied by the cell length, area or volume. The calculation sums the resulting quantities over the zone
or specified subset to produce the integrated result.”
Additionally, this Knowledge Base article gives further information on how Tecplot 360 calculates cell-centered quantities.
Therefore, for the example question (Figure 1), the weighted average is calculated as follows: the mean of the 4 face nodes is calculated for each cell. This cell-centered quantity is then multiplied by the cell area (weighted in other words). This quantity is calculated for each cell, the quantities are summed, and then divided by the total plot area. This result (the weighted average) is dissimilar to a mean of the nodal values and explains the difference noted in the example question.
Works Cited:
¹ Tokgoz, N. Experimental and numerical investigation of flow structure in a cylindrical corrugated channel. International Journal of Mechanical Sciences. Volumes 157–158, July 2019, Pages 787-801.