


 MENU
MENUQuestion:
The symmetry of nodal Grid K Unit Normal values differ from the comparable cell-centered values (see Figure 1). How are nodal Grid K Unit Normal values calculated?1
Explaining the Question:
In Figure 1, at nodes 1, 6, 11, 16, and 21 the X Grid K Unit Normal vectors are equal. However, on the data row below it (nodes 2, 7, 12, 17, and 22), the components of the X Grid K Unit Normal are not equal. The values for these components range from 0.1978 to 0.2714. Why is this row not equal?
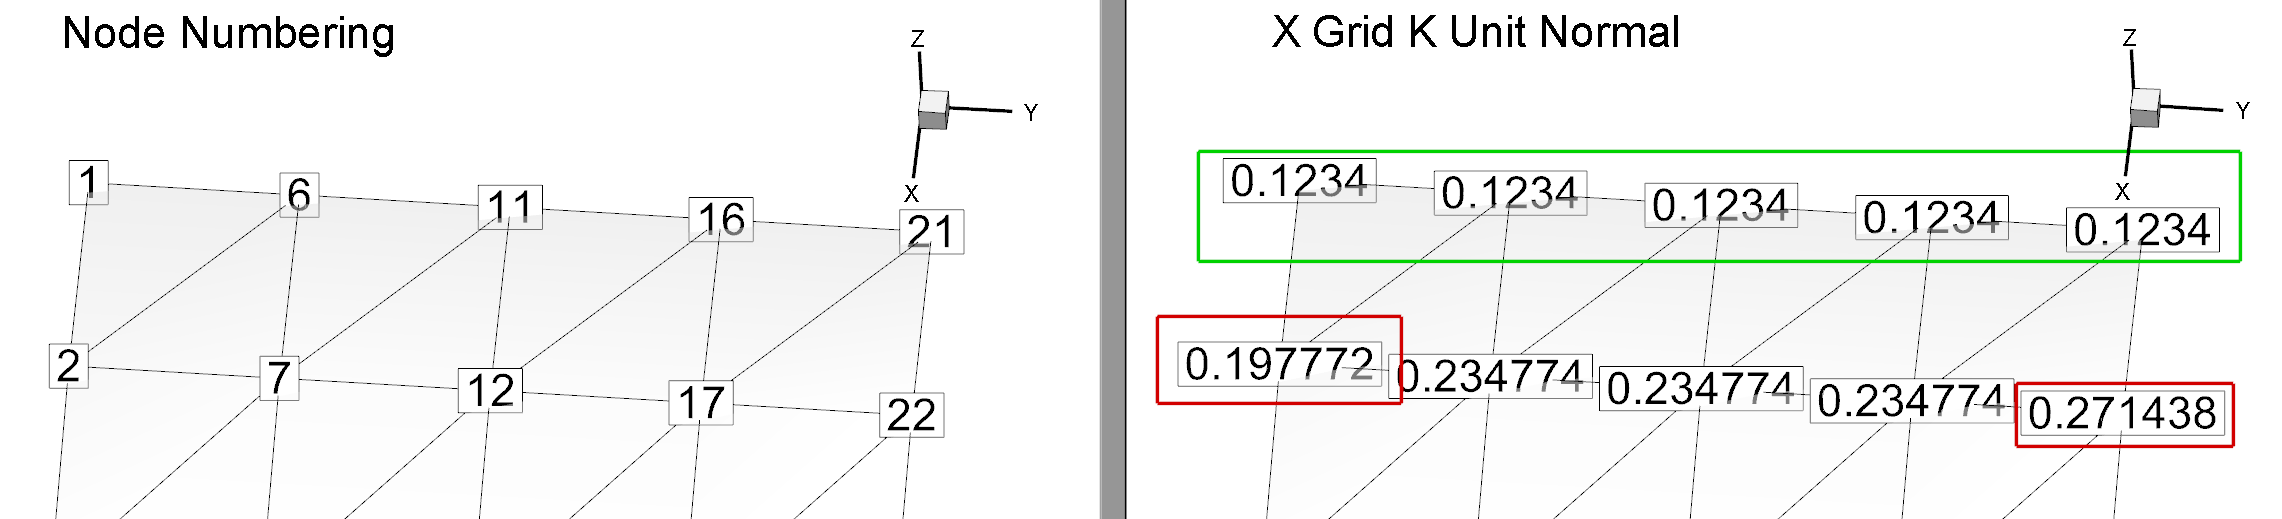
Figure 1: Nodal X Grid K Unit Normal Components with Highlighted Contrasting Values
A similar result is present in the other components of the Grid K Unit Normal vector.
Answer:
In order to understand the nodal Grid K Unit Normals, we must first focus on the cell-centered Unit Normals. The right-hand rule is used to calculate the surface unit normal vector for faces.2 If you’re calculating Unit Normals as a nodal variable, each component of the face normals is then arithmetically averaged to the nodes and the resulting vectors are re-normalized.3 This arithmetic averaging accounts for the values found at the nodes.
In this KB’s example, if you calculate the Unit Normals as cell-centered variables and label the cells4 with the X components as seen in Figure 2, you can see why you get the values found in Figure 1. See the discussion below Figure 2 for the details.
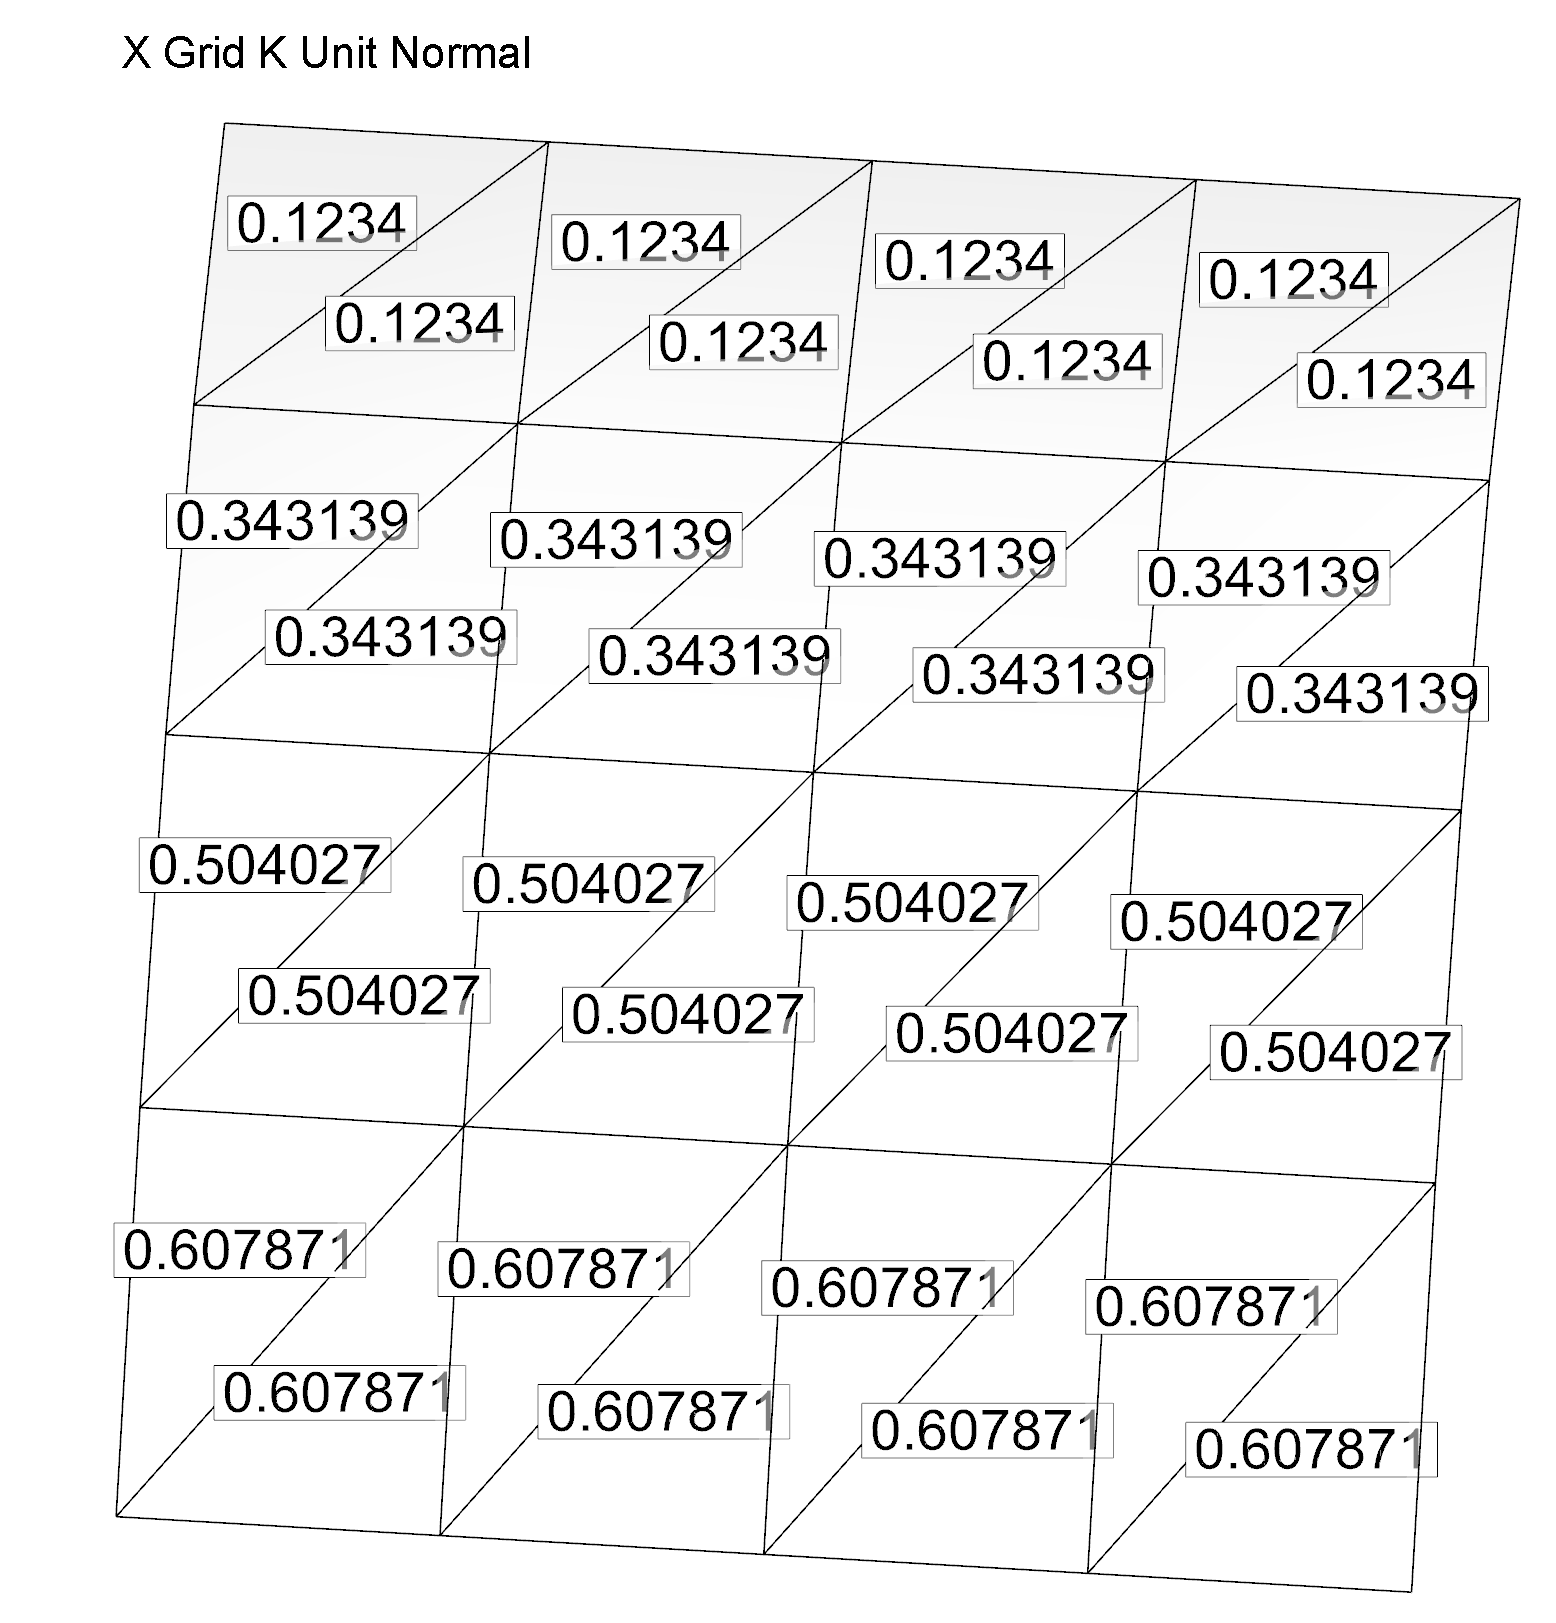
Figure 2: Cell-Centered X Grid K Unit Normal Components
Node 2 will be set to the average of .1234, .1234, and .3431, giving .1966, and later normalized to .1977. Node 7 will be the average of .1234, .1234, .1234, .3431, .3431 and .3431, or .2333, and then normalized, giving .2348. Similar calculations generate the values at the other nodes in Figure 1, and explains why these nodal values are not equal. The value at each node is calculated from the mean of the cell-centered values of the triangles intersecting that node.
Notes:
1 The subject of normals usually comes up in relation to integrals, so that’s where the discussion is in the User’s Manual (Performing Integrations). However, this information in the User’s Manual is insufficient to answer this question.
2 For more details on calculating and displaying surface normals on your plot, see the KB article, Verifying Surface Normals in Integral Calculations.
3 Note that in process of calculating the Grid K Unit Normal vector the “Normalize” menu in the Calculate dialog (Analyze > Calculate Variables…) has no meaning here—the calculated vectors are always normalized to unit length.
4 In order to label nodes or cells, go to Plot > Label Points and Cells…